It seems like I did not update my blog for almost a month. The reason is that lately, I spent most of my time on preparing the interviews and also taking the deep learning courses on Coursera by Andrew Ng (I will summarize what I have learned from this course later on).
Today I will continue my Spark learning since one of my latest interviews needs me to have such skills. Without further ado, let us see what is Spark MLlib.
MLlib is Spark's machine learning library. Its goal is to make practical machine learning scalable and easy. At the very start, MLlib is an RDD-based library; but since the appearance of Spark Dataframe, it is recommended to use DataFrame instead.
1. Data Types
Even though we will use DataFrame as our main input for performing machine learning; I think it is still very necessary to know the basic RDD-based data types.
1.1 Local Vectors and Labeled Point
Local vector is the basic composition of the RDD data. There are two types:
- Dense Vector: double array
- Sparse Vector: indices and values
Let us see one example:
from pyspark.mllib.linalg import Vectors
from pyspark.mllib.regression import LabeledPoint

# Create dense vector
Vectors.dense([2,0,4]) # --> DenseVector([2.0,0.0,4.0])

# Create sparse vector
Vectors.sparse(3,[0,2],[2.0,4.0]) # 3 is the size, [0,2] represnet the location of non-zero values

# Create a Labeled point
LabeledPoint(label = 1, features = Vectors.dense([2,0,4]))
1.2 Local Matrix
A local matrix has integer-typed row and column indices and double-typed values, stored on a single machine. Similar to local vector, we also have the dense matrix and sparse matrix here. Due to the appearance of Spark DataFrame, the RDD-based matrix is used less and less, so I will ignore other matrix type derived from the local matrix.
from pyspark.mllib.linalg import Matrices

# Create a dense matrix
Matrices.dense(3,2,[1,2,3,4,5,6])

# Create a sparse matrix
Matrices.sparse(3,2,[0,1,3],[0,2,1],[9,6,8])
2. Machine Learning
Now we have the prerequisite knowledge of performing machine learning on Spark: basic RDD data type and Spark Dataframe (On last Spark post). Then can we use these data directly to perform a ML algorithm?
The answer is No. That is the difference between performing ML on Spark and on sklearn. Here are some detailed differences:
- Spark DataFrame is not mutable, so always we need to use some transformer to transform our DataFrame
- The DataFrame should have features and label column for supervised learning where features contain all the independent information and label contains the dependent information.
- There are several ways to construct Spark Dateframe, depending on the format of our source data (Detailed information is in my last spark post)
Except for the things above, the procedures are quite similar to normal sklearn machine learning. I will not list all the ML algorithms here, but I want to use Logistics Regression and Random Forest to illustrate two ways to deal with the ML problems.
2.1 Logistic Regression
I will use the classic iris data set to perform this classification. This time I would like to use pandas to manipulate the dataframe first and transform to Spark DataFrame.
First using pandas to create a two class datasets
import pandas as pd
from pyspark.sql import SparkSession

spark = SparkSession.builder.master('local').appName('try').getOrCreate()

# Create Toy Data
pd_df = pd.read_csv('/Users/gongfan/Desktop/iris', sep=',', header=None)
pd_df.columns = ['feature1','feature2', 'feature3','feature4','label']
pd_df = pd_df[pd_df['label'].isin(values=['Iris-setosa', 'Iris-versicolor'])]

pd_df.loc[:,'label'][pd_df['label'] == 'Iris-setosa'] = 0
pd_df.loc[:,'label'][pd_df['label'] == 'Iris-versicolor'] = 1
Then I transformed it to spark DataFrame
df = spark.createDataFrame(pd_df)
# Transform the Dataframe to (features, label) format
df.rdd.map(lambda x: (Vectors.dense(x[0:-1]), x[-1])).toDF(["features", "label"]))

# Results:
+-----------------+-----+
|         features|label|
+-----------------+-----+
|[5.1,3.5,1.4,0.2]|    0|
|[4.9,3.0,1.4,0.2]|    0|
|[4.7,3.2,1.3,0.2]|    0|
+-----------------+-----+
Next is model training, which are quite similar to sklearn:
from pyspark.ml.classification import LogisticRegression

# train test split
(df_train, df_test) = df.randomSplit([0.7,0.3], 42) # 42 is the RandomState

# Train Logistic Regression Model
lr = LogisticRegression(maxIter=20, regParam=0.3, elasticParam = 0.8)
lrModel = lr.fit(df_train)

# Make Prediction
predict = lrModel.evaluate(df_test)
predict.predictions.show(3)

#Results:
+-----------------+-----+--------------------+--------------------+----------+
|         features|label|       rawPrediction|         probability|prediction|
+-----------------+-----+--------------------+--------------------+----------+
|[4.4,2.9,1.4,0.2]|    0|[0.93747822263454...|[0.71858998880745...|       0.0|
|[4.4,3.0,1.3,0.2]|    0|[0.97002544348423...|[0.72512456918688...|       0.0|
|[4.4,3.2,1.3,0.2]|    0|[0.98632612358187...|[0.72836165252631...|       0.0|
+-----------------+-----+--------------------+--------------------+----------+
Finally for model evaluation, We can transform the evaluation results back to pandas and make plots:
roc = predict.roc.toPandas()
plt.plot(roc['FPR'], roc['TPR'], marker = '.')
plt.plot([0,1], [0,1], linestyle = '-', marker = '.')
plt.xlabel('FPR')
plt.ylabel('TPR')
plt.title('ROC Curve')
plt.show()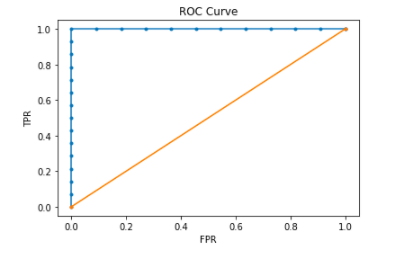
Conclusion: It seems like the first method is quite restrictive since we perform our data wrangling on pandas; still, the speed will be very slow on big data. So this method is only available for dealing with middle size complicated data. For big data, we need to use the next method which is pure Spark.
2.2 Random Forest Model
Then let us use a pure Spark way to make classification. To perform data manipulation in Spark DataFrame, we need several more functions:
- StringIndexer:
pyspark.ml.feature.StringIndexer(inputCol=None, outputCol=None, handleInvalid='error', stringOrderType='frequencyDesc')A label indexer that maps a string column of labels to an ML column of label indices (numerical). - OneHotEncoder:
pyspark.ml.feature.OneHotEncoder(dropLast=True, inputCol=None, outputCol=None)maps a column of label indices to a column of binary vectors, with at most a single one-value - VectorIndexer:
pyspark.ml.feature.VectorIndexer(maxCategories=20, inputCol=None, outputCol=None, handleInvalid='error')Automatically identify categorical features, and index them. We specify maxCategories so features with > max distinct values are treated as continuous - IndexToString:
pyspark.ml.feature.IndexToString(inputCol=None, outputCol=None, labels=None)maps a column of label indices back to a column containing the original labels as strings
By just looking at these function explanation is quite confusing, let me then take random forest model as an example to use them:
This time, I will first create Spark DataFrame by using RDD:
from pyspark.ml.classification import RandomForestClassifier
from pyspark.ml.feature import StringIndexer, VectorIndexer, IndexToString
from pyspark.ml.evaluation import MulticlassClassificationEvaluator

rdd = spark.sparkContext.textFile('/Users/gongfan/Desktop/iris')
rdd = rdd.map(lambda x: x.split(',')) # split the row data by comma

# Map the rdd to (features, label) format and then transform to DataFrame
df = rdd.map(lambda x: (Vectors.dense(x[0:-1]), x[-1])).toDF(["features", "label"])

#Results:
+-----------------+-----------+
|         features|      label|
+-----------------+-----------+
|[5.1,3.5,1.4,0.2]|Iris-setosa|
|[4.9,3.0,1.4,0.2]|Iris-setosa|
|[4.7,3.2,1.3,0.2]|Iris-setosa|
+-----------------+-----------+
Then let me use StringIndexer to transform my string label to a numerical one. If we have categorical features we could use OneHotEncoder or VectorIndexer to transform them in a similar way.
labelIndexer = StringIndexer(inputCol='label', outputCol='indexedLabel').fit(df)

df = labelIndexer.transform(df)

# Results:
+-----------------+-----------+------------+
|         features|      label|indexedLabel|
+-----------------+-----------+------------+
|[5.1,3.5,1.4,0.2]|Iris-setosa|         0.0|
|[4.9,3.0,1.4,0.2]|Iris-setosa|         0.0|
|[4.7,3.2,1.3,0.2]|Iris-setosa|         0.0|
+-----------------+-----------+------------+
Then we train our model:
(df_train, df_test) = df.randomSplit([0.7,0.3], 42)
rf = RandomForestClassifier(labelCol='indexedLabel',
                            featuresCol='features', # sometimes use 'indexedFeatures which transformed by VectorIndexer'
                           numTrees = 10)
Next, we want to make predictions, and here we use IndexToString to covert our indexed labels back to original labels.
# Create our label converter
labelConverter = IndexToString(inputCol="prediction", outputCol="predictedLabel",
                               labels=labelIndexer.labels) # original label names

# make prediction
rf = rf.fit(df_train)
rf_prediction = rf.transform(df_test)
rf_prediction = labelConverter.transform(rf_prediction)
rf_prediction.show(3)

# Results:
+-----------------+-----------+------------+--------------+-------------+----------+--------------+
|         features|      label|indexedLabel| rawPrediction|  probability|prediction|predictedLabel|
+-----------------+-----------+------------+--------------+-------------+----------+--------------+
|[4.4,2.9,1.4,0.2]|Iris-setosa|         0.0|[10.0,0.0,0.0]|[1.0,0.0,0.0]|       0.0|   Iris-setosa|
|[4.4,3.0,1.3,0.2]|Iris-setosa|         0.0|[10.0,0.0,0.0]|[1.0,0.0,0.0]|       0.0|   Iris-setosa|
|[4.4,3.2,1.3,0.2]|Iris-setosa|         0.0|[10.0,0.0,0.0]|[1.0,0.0,0.0]|       0.0|   Iris-setosa|
+-----------------+-----------+------------+--------------+-------------+----------+--------------+
Finally, don't forget to evaluate our model. Here I use MulticlassClassificationEvaluator module from pyspark.ml.evaluation library, it also has other evaluation methods such as RegressionEvaluator for regression problems.
evaluator = MulticlassClassificationEvaluator(labelCol="indexedLabel", predictionCol="prediction", metricName="accuracy")
accuracy = evaluator.evaluate(rf_prediction)

print("Test Accuracy = {}".format(accuracy))

# --> Test Accuracy = 0.9444444444444444
3. Something needs to be notice..
When I used some modules in pyspark machine learning lib, I got several errors that I did not know why. Later I realized that there are two different machine learning modules in pyspark and may contain same functions and classes, so I think it is necessary to clarify their differences:
spark.mllib: Contains the original API built on top of RDDsspark.ml: Provides higher-level API built on top of DataFrames for constructing ML pipelines.
They may have same modules within these two libraries, but they are not compatible. So make sure which module to use dealing with different problems.